Reading time: 3 Minutes
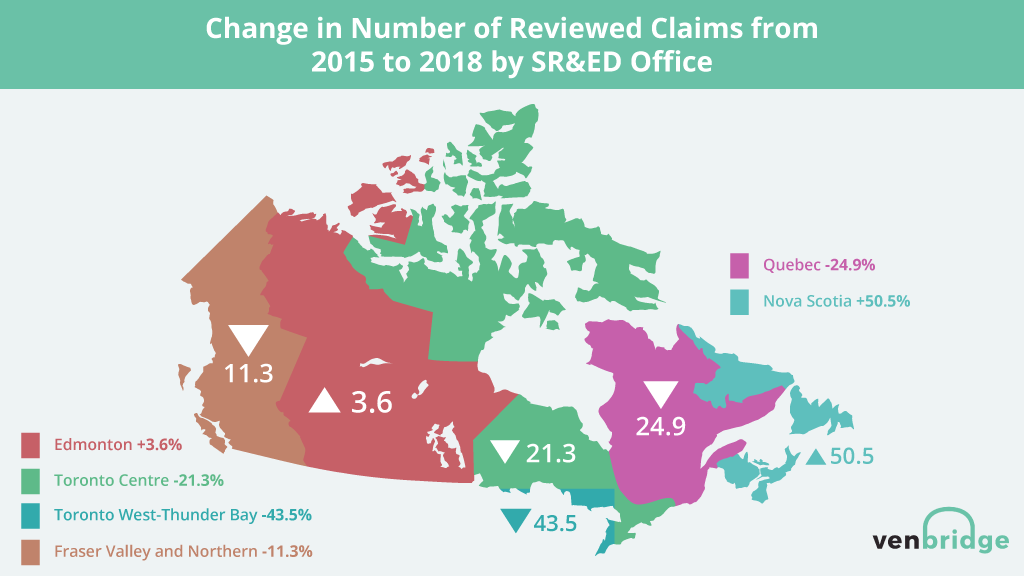
Since 2015, the number of SR&ED claimant reviews conducted by the Canada Revenue Agency (CRA) has dropped by 22.2%, from 4,369 reviews in 2015 to 3,400 in 2018. The reviews are both technical and financial; they are conducted by a Research and Technology Advisor and/or Financial Reviewer from the CRA. Quebec and Toronto West account for the greatest decline over this period, most dramatically in 2017 and 2018. In Quebec for 2015 and 2016, the number of reviews was 1,231 and 1,215 respectively. However, in 2017, reviews dropped to 1,012 and then 925 in 2018. In the Toronto West SR&ED tax office, the number of reviews declined by a whopping 43.5% between 2015 and 2018. Tax offices representing the Prairies, British Columbia, Toronto Centre, and Eastern Canada did not experience a significant change in the number of SR&ED reviews.

We may never know the reason for the decline in reviews, however, during this period, the Associate Director (AD) in these regions changed. The AD is responsible for the SR&ED tax office. Does the AD in the region have the ability to influence the number of taxpayers selected for review? In fact, how much flexibility does the AD have for a Canada-wide tax incentive program?
Quebec and Toronto Centre Tax Office Adjustment Rates Plummet while Fraser Valley and Northern Increases
Given the number of reviews conducted, the question everyone wants to know is what was the adjustment rate over this period? The adjustment rate is the reduction in investment tax credits (ITCs) as a result of the CRA’s review. For example, if a SR&ED claimant filed for $100,000 of ITCs and was selected for review and assessed for $80,000 of ITCs the adjustment rate would be $20,000 or 20.0%.
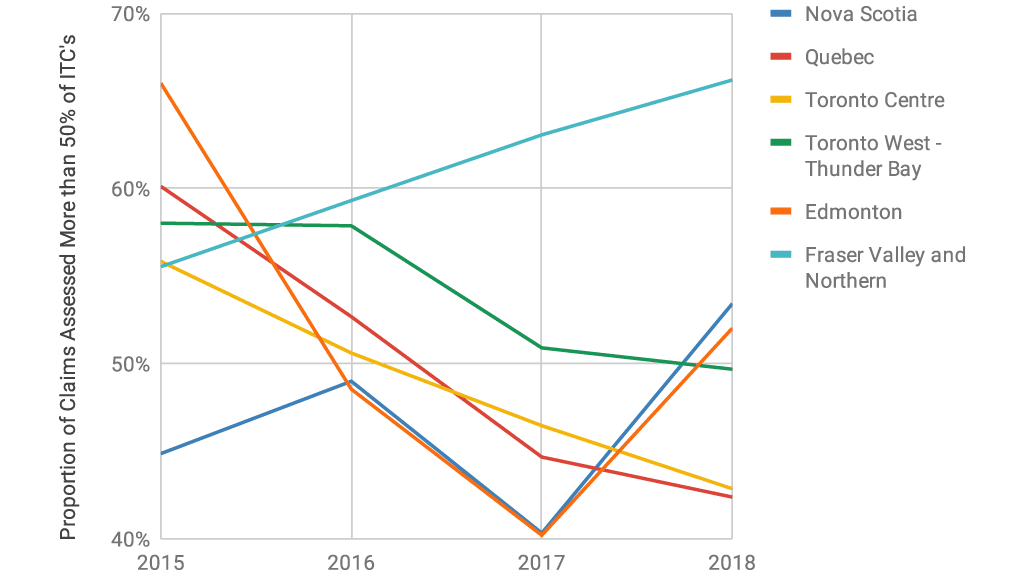
This chart shows the proportion of SR&ED claims that were selected for review and assessed for more than 50% of the ITCs filed. Put another way, if a claimant filed a SR&ED claim that was selected for review, how often would they receive more than 50% of the SR&ED ITCs that were filed?

The results are mixed. From 2015 to 2018 the Fraser Valley and Northern SR&ED office increased the proportion of claims which received more than 50% of ITCs claimed after review from 56% to 66%. Conversely, Quebec reduced the proportion of claims that received more than 50% after review from 60% in 2015 to 42% in 2018. Toronto Centre was similar going from 56% in 2015 to 43% in 2018. Similar declines are also seen in the Edmonton and Toronto West SR&ED tax offices.
On a national basis, the proportion of claims which received more than 50% of the ITCs filed decreased from 58% in 2015 to 54% in 2016 to 48% in 2017 and increased to 49% in 2018. If your claim was selected for review in 2018, chances are you would receive about 49¢ for each $1.00 claimed.
Quebec and Toronto Centre Tax offices Deny More Than One-Third of Reviewed Claims
There are additional interesting data. In Canada in 2015, 27% of claims that were selected for review were approved at 100% or more. In 2017 the number of claims that were approved at 100% or more fell to 17% and in 2018, 19%. Once again Quebec and both Toronto offices are at the bottom of the pack with approximately 16% of claims being assessed for 100% or more after review in 2018.
In Quebec and Toronto Centre, a staggering 37% of SR&ED claims were denied in 2018. This is curious. Toronto West denies 21% of claims and Fraser Valley and Northern 18% in 2018. Nationally, the number of claims denied after the review has risen from 26% in 2015 to 30% in 2018.
Companies do not decide where to reside based on the likelihood of receiving a SR&ED review or a favourable review. However, there are clear differences between the six tax S&RED tax services offices. Why these differences exist is unclear and speculative. It would benefit the great companies of Canada and the CRA if there were greater predictability, uniformity and clarity in the SR&ED program.


